How to improve SEO by boosting website speed
Recently I taught myself how to conduct technical audit to improve SEO and want to share my knowledge here.
My two reasons for speed slowdown were Image Sizes and Font Awesome. Read on to learn my solutions.
Note: Although my solutions are universal, I have some specific advice for those who built their website with Minimal Mistakes Jekyll theme and run it on GitHub Pages.
Why speed matters?
Website’s speed affects a lot of important metrics such as:
- the ranking position in Google Search results
- bounce rate
- conversion rate
Just by reducing the page load time from 3 seconds to 1 second, you can reduce bounce rate by 32%, according to Google data.
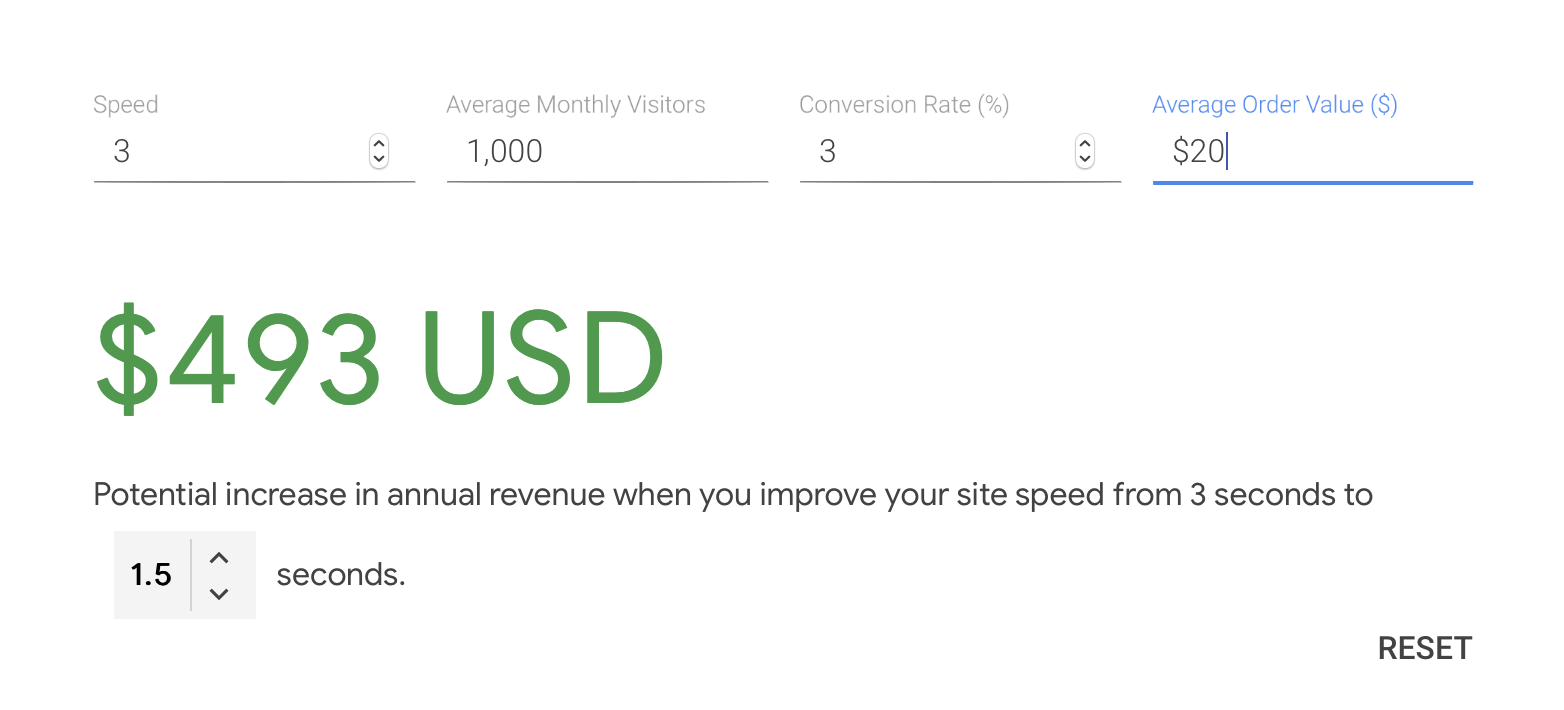
Google also created a useful tool that allows you to measure the impact of a faster site on your revenue. Here’s an example:

Running Speed Test
You can run speed test in two (identical) ways:
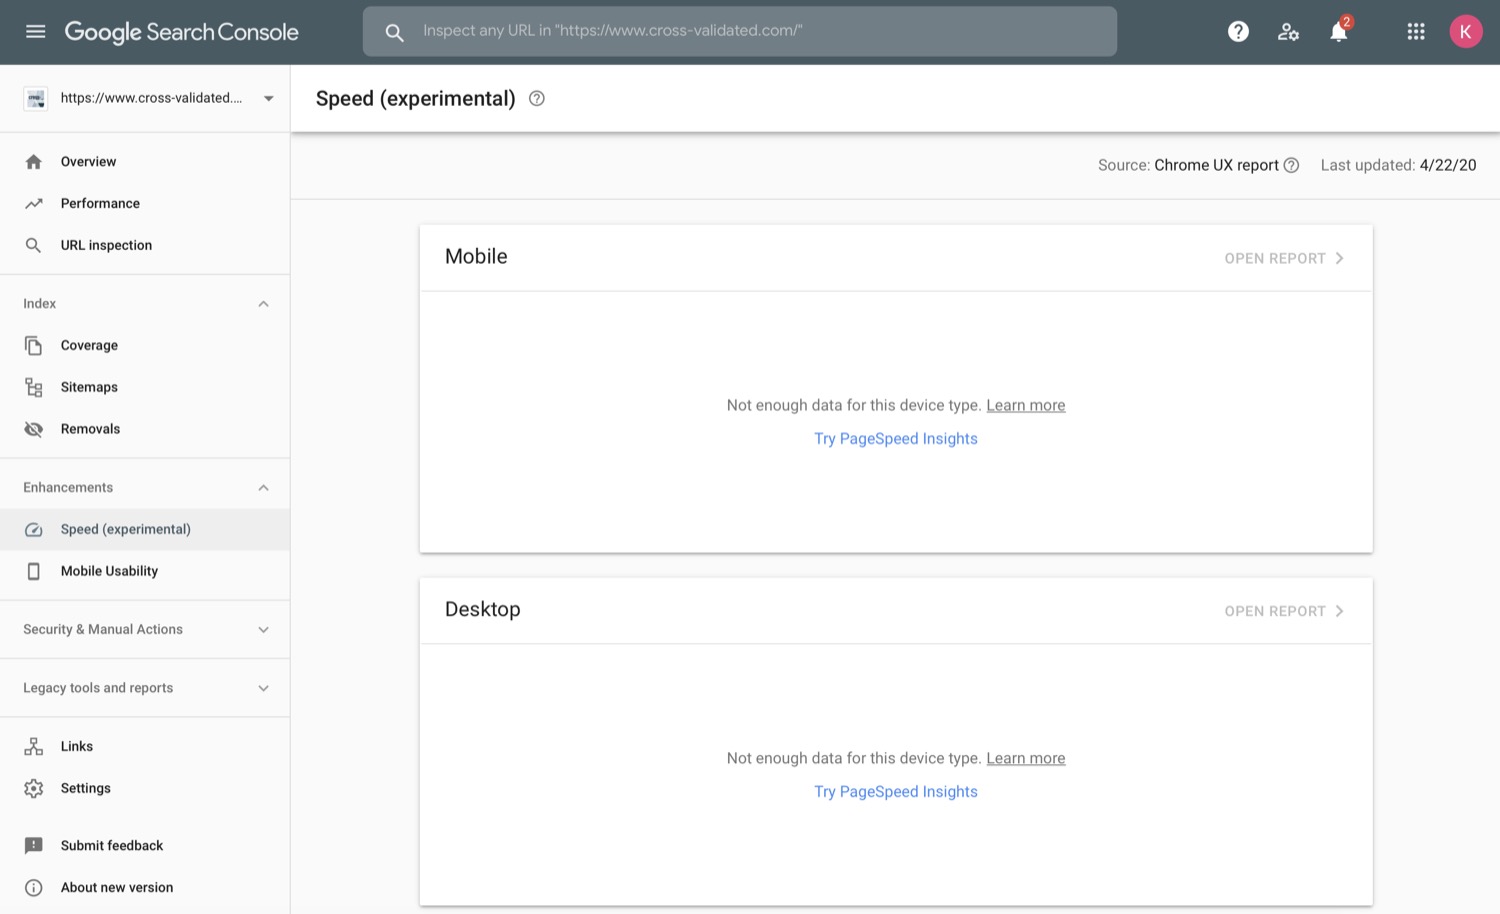
- with Page Speed Insights from Google Search Console Speed tab

- From Chrome Dev Tools Audits tab (Lighthouse)

Both tests produce reports across mobile and desktop devices. While Google’s PageSpeed Insight tool shows you only the Performance score, Lighthouse tool accessible from Chrome Dev Tools provides few more metrics on top of Performance such as Accessibility, Best Practices and SEO.
Note: If you want to learn more about Lighthouse Score components and how they are created, checkout this official Lighthouse Score Weighting doc. There is also a free Website Performance Optimization course on Udacity.
Benchmark Score
The tools such as Lighthouse or PageSpeed Insights allow you to test the speed of any page of your website. I decided to start with the main page - https://www.cross-validated.com
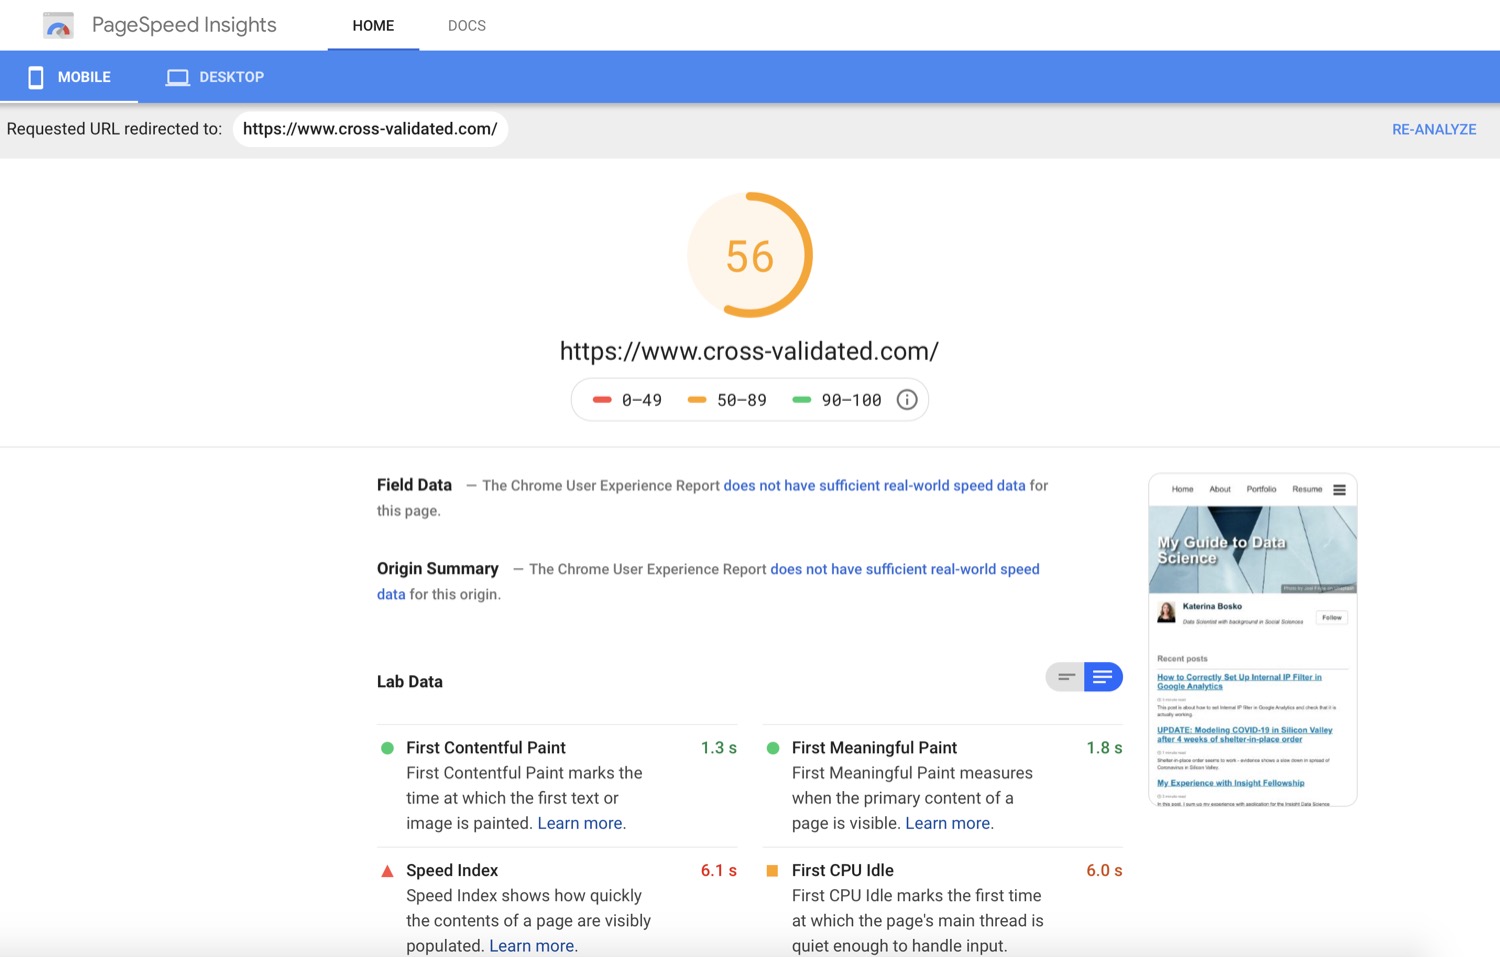
When I first checked my blog’s performance, it turned out that the page speed was really good for desktop version (98/100) but only average for mobile version (56/100 rating):

Troubleshooting why it took so long for my website to load, I came down to two main delay sources - Large Images and Font Awesome.
Speed Delay Sources
Large Images
Large image sizes are really critical for the site’s mobile version. It turned out that my avatar was 1.3 Mb and it was one main reason for the average audit score. Interestingly, this wasn’t a problem for the desktop version, where I got a score of almost 100.
I knew that big image sizes adversly affect the load time. But how big is big? Before I thought that the image quality is the king and the size around 400 kb is really small. Now I try to optimize my images and resize them to get good quality with the maximum image size around 100 Kb.
I batch resize image files from Mac Terminal using native sips (scriptable image processing system) like so1:
# Batch Resize
sips -Z 800 *.png

# Batch Convert PNG to JPG
mkdir jpegs; sips -s format jpeg *.* --out jpegs

# Batch Convert JPG to PNG
mkdir pngs; sips -s format png *.* --out pngs
For screen shots captured automatically with Command+Shift+4 on Mac, it works best if you first resize the png screen shot and then convert it to jpeg.
Note: There is a nice Jekyll plugin to automatically resize images - Picture Tag. However, if you host your website on GitHub Pages like me, you can’t use this tool because it is not supported by GitHub Pages. GitHub Pages cannot build sites using unsupported plugins.
Font Awesome
Font Awesome provides Twitter, LinkedIN, GitHub and other icons on my blog. Before optimization, it was delivered as JavaScript and was very slow to load.
The solution is to load a CSS version of Font Awesome instead of JavaScript.
If you are using Jekyll Minimal Mistakes theme like me, you can switch to Font Awesome CSS like so:
- Go to
head.htmland add Font-Awesome minified CSS delivered from Cloudflare CDN as a second line aftermain.csslike so:
<!-- For all browsers -->
<link rel="stylesheet" href="/assets/css/main.css">
<link rel="stylesheet" href="https://cdnjs.cloudflare.com/ajax/libs/font-awesome/5.9.0/css/all.min.css">
- Delete the referral to Font Awesome JavaScript from
_includes/scripts.html:
<script src="https://kit.fontawesome.com/4eee35f757.js"></script>
Performance Score after Optimization
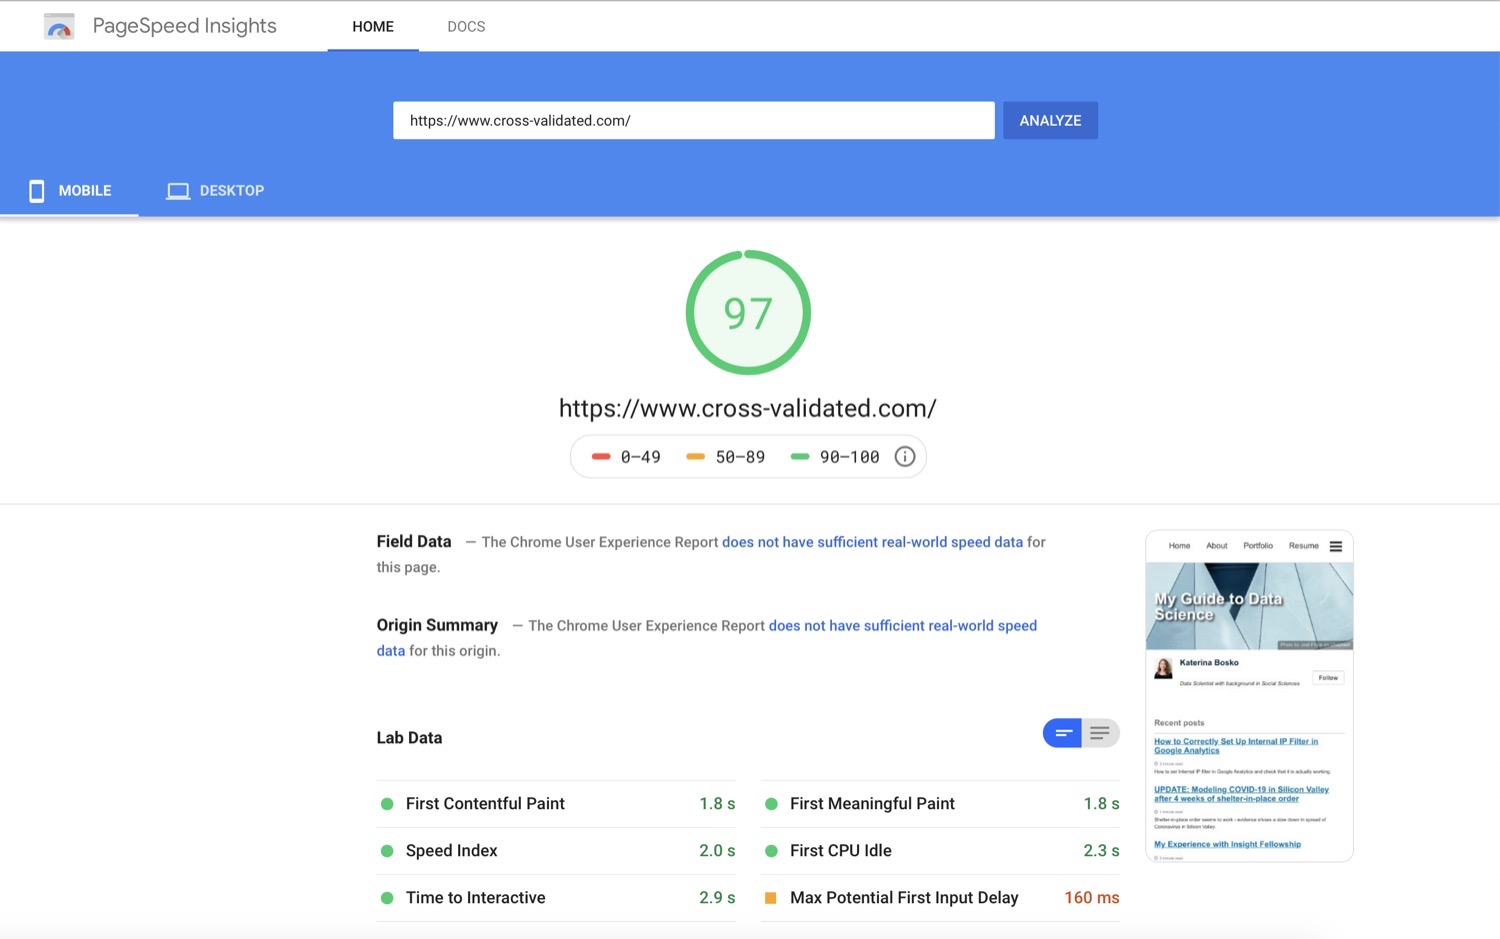
Resizing large images and switching to CSS for Font Awesome boosted the page’s performance score from 59 to 97 on mobile:

Further Testing and Unresolved Problems
Testing pages with posts, however, showed again average results (around 80/100). The major problem is that I’m using several third-party JavaScript providers such as:
- Disqus (commenting platform)
- Google Analytics
- Google Tag Manager (Google Optimize was installed with GTM)
- MathJax
Switching off Disqus, for instance, almost halved Time to Interactive (from 11s to 6s). Right now, I am not ready to give up on Disqus. So I think this is a trade-off I have to face.
Another problem that I can’t solve right now is the caching time of static assets. Since I’m hosting on GitHub Pages, I cannot change cache policy which apparently is only 10 m for images on GitHub. :( Now thinking about about moving my site to AWS cloud.
-
Learned about it thanks to Tutorial Shares. ↩

